Overview
Recent data and statistics on Ig use in Australia is presented below, providing a snapshot of Ig usage and trends in Australia. To accommodate data entry and reconciliation requirements, data is usually published approximately three months in arrears.
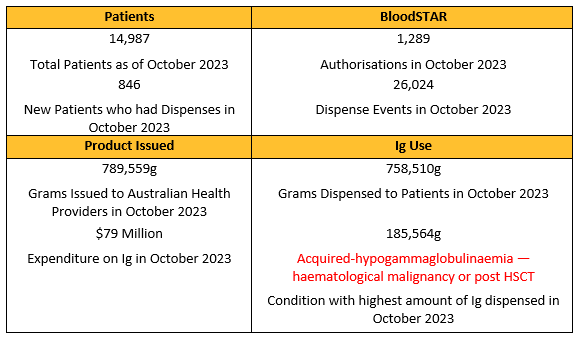
Snapshot
The snapshot provides an overview of the information that is further detailed in the graphs and tables that follow.
Ig use
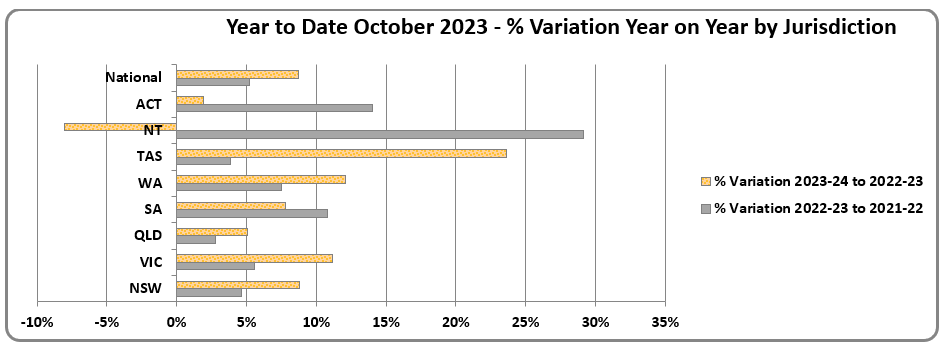
Year to date September 2023 - % variation year on year by jurisdiction. This graph shows a cumulative percentage changes in Ig issued, nationally and by jurisdiction, for the current financial year to date as compared to the same period in the previous financial year.
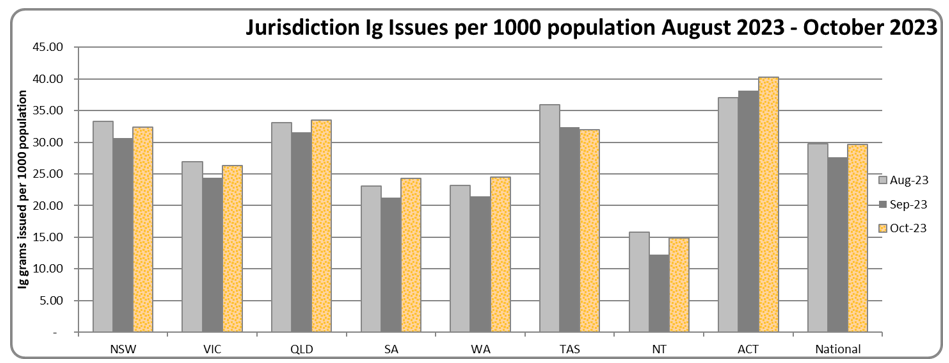
Issues of Ig per 1,000 population by jurisdiction. This graph shows the amount of Ig issued (grams) per 1,000 population nationally and by jurisdiction for the previous 3 months.
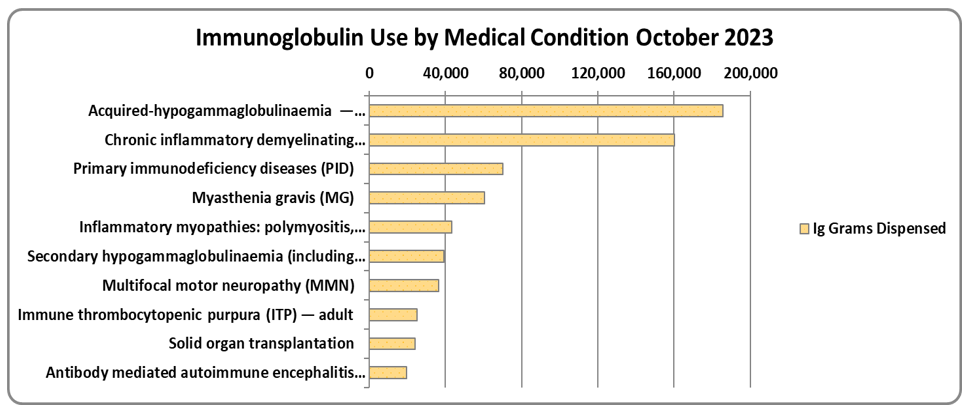
Ig u
se by medical condition. This graph shows the medical conditions which account for the highest use (grams dispensed) of Ig products.
Product issued
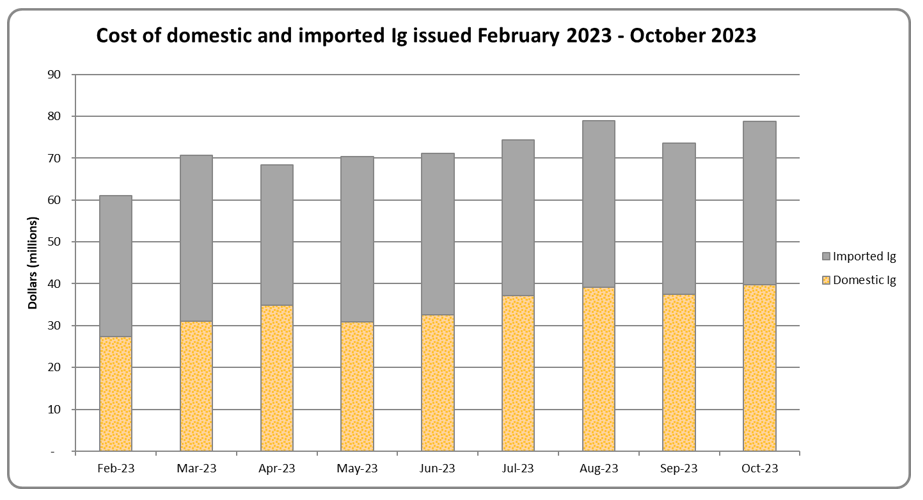
Monthly expenditure on Ig. This graph shows the cost of Ig products issued over the last 9 months.
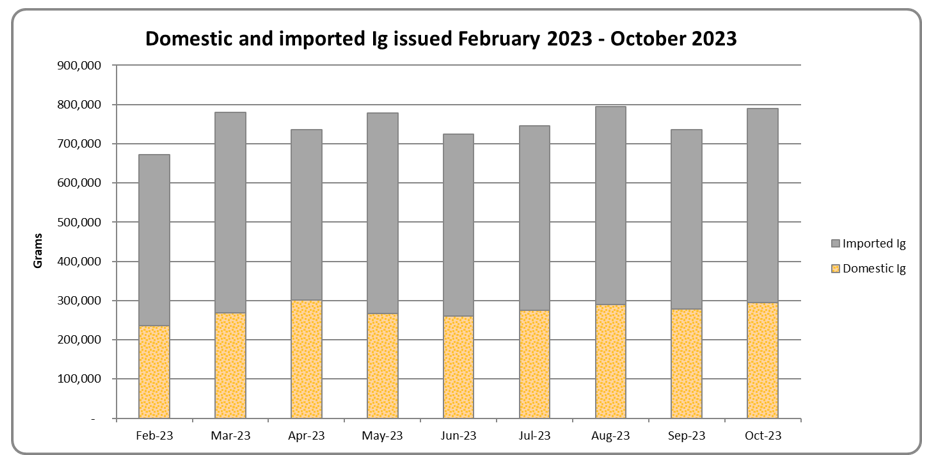
Monthly usage of Ig. This graph shows the amount of domestic and imported Ig products issued (grams) in the last 9 months.
BloodSTAR
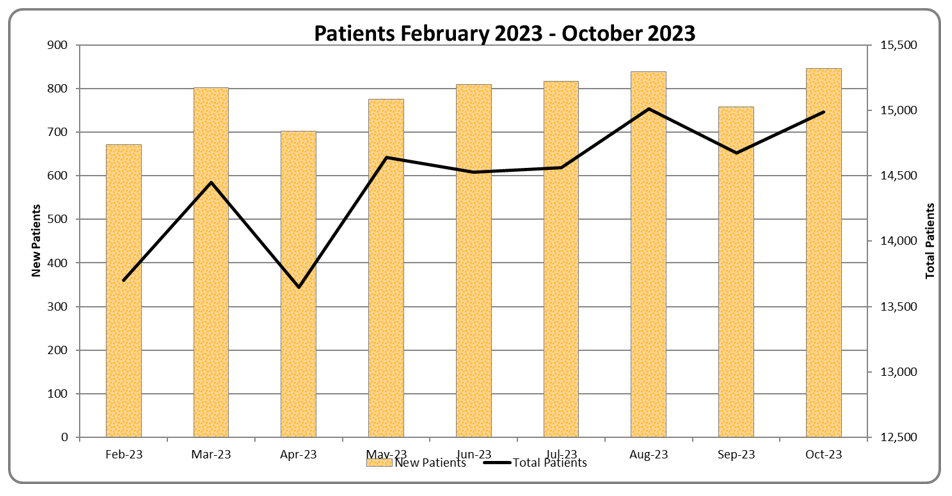
Patients. This graph shows the total number of patients receiving Ig and the number of new patients over the last 9 months.
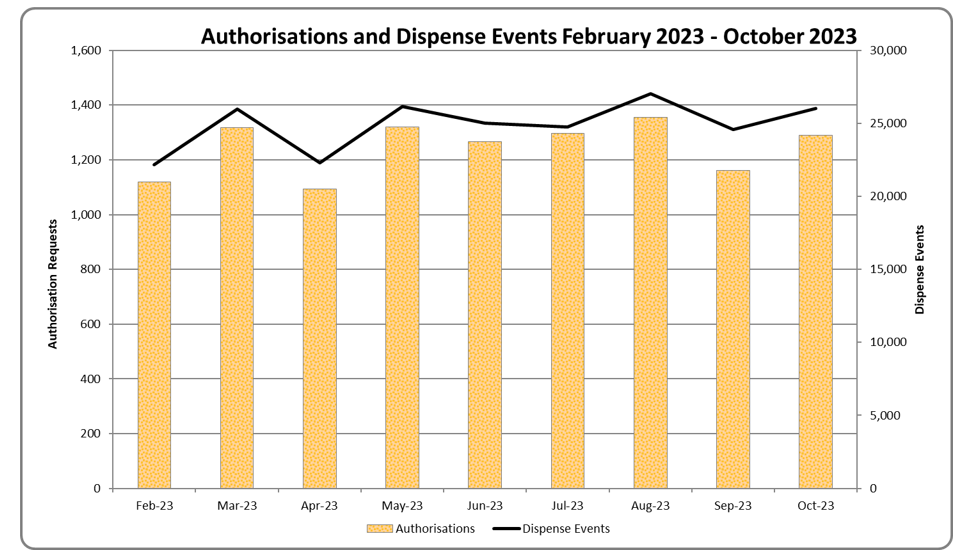
Authorisation and dispense events. This graph shows the number of new authorisation requests approved and the number of dispense events over the last 9 months.
Facilities and Users as of 30 September 2023


More information
Annual reports on the issue and usage of immunoglobulin provide further information. For context and links, see: www.blood.gov.au/Ig - Ig Data, Statistics, Reporting and Performance Improvement.
In addition:
-
BloodSTAR Facility Administrators can access reports about their facility’s Ig usage through the reports function in BloodSTAR
-
Jurisdictional Reports are available to Jurisdictional Blood Committee (JBC) representatives and their nominees. These provide information on the Ig dispensed for each State and Territory
-
The NBA will also consider specific requests for data. All requests will be considered in line with the NBA’s Data and Information Governance Framework. More information, including about how to submit data requests, is available here.
Keep up to date
Ig Program Updates provides a snapshot of the NBA’s current work program and priorities in the immunoglobulin space. It is updated quarterly.
To receive the latest Immunoglobulin Governance Program Updates by email, join the Ig Updates and National Immunoglobulin Interest Group (NIIG) subscription list: email Iggovernance@blood.gov.au with the words SUBSCRIBE Ig Program Updates and NIIG in the subject line.
In the body of the email, please indicate your interest (e.g. Healthcare Professional/Patient/ Government, etc.) and include your signature block.
Subscribers receive notification of the quarterly Ig Program Updates, and may also be invited to informally discuss and comment on individual Ig-related issues as they arise (participation is optional).
For more information on NIIG, see: www.blood.gov.au/Ig-committees.